
Current Trends Are Not Sustainable

Current Trends Are Not Sustainable
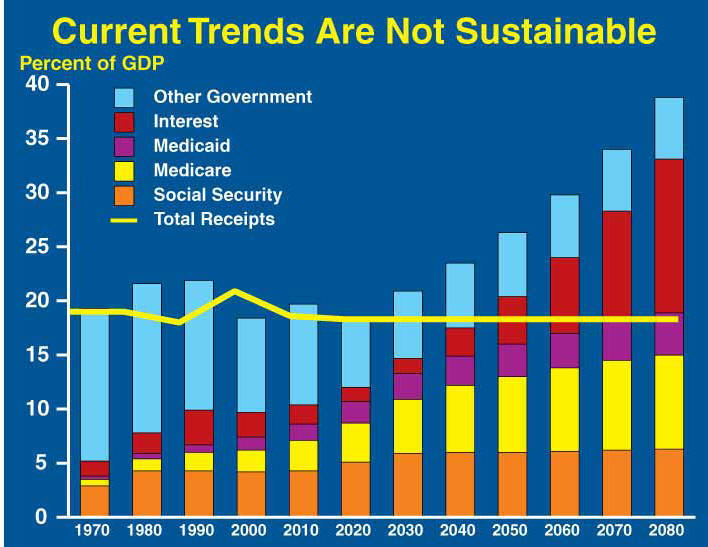
This graph shows Government spending, expressed as a percent of GDP, in ten-year intervals for 1970 to 2080. The chart also shows Government receipts, expressed as a percent of GDP, as a line from 1970 to 2080.
The vertical scale on the chart goes from zero to 40 percent of GDP. The data for 1970 through 2000 reflect actual spending and receipts. The data for 2010 through 2080 reflect projections. Spending is shown as stacked bars with Social Security on the bottom, Medicare stacked on top of Social Security, Medicaid on top of Medicare, Interest on top of Medicaid and Other Government on the very top.
The chart shows that between 1970 and 2020, Government receipts are generally equal to total Government spending.
The chart also shows that over the long term, Social Security is projected to increase slightly, Medicare and Medicaid are projected to increase quite significantly, and interest is projected to increase dramatically. Interest is projected to grow dramatically because the chart assumes that Government receipts will remain at their 40-year historical level of 18.3 percent of GDP while total Government spending, especially Medicare and Medicaid, continue to grow. Increases in spending with receipts held constant, as a percent of GDP, will require the Government to borrow more money from the public, which leads to increases in interest.
The chart shows that by 2030, Government spending will exceed historical levels of receipts and lead to ever increasing amounts of borrowing. The chart also shows that if receipts remain at their historical level of 18.3 percent of GDP, by 2070, receipts will be sufficient to cover the costs of only Social Security, Medicare and Medicaid.
Senior Trend Entitlement Spending