
Global Trends: Armed Conflicts Decline
 Global Conflict Trends
![]()
This web page was last updated on September 11, 2010
Global Conflict Trends graphs now being updated to include information through the year 2009
Measuring Systemic Peace
Perhaps, the most important, and challenging, task for the peace researcher is to establish and maintain a systematic perspective on the general condition of peace in the global system. Without that, progress toward greater peace cannot be gauged and social policies cannot be properly evaluated. Measuring systemic peace is a necessarily holistic endeavor. Peace is an absolute term and, therefore, a universal condition. The quality of peace can not be improved simply by displacing violence and war to a different setting, or separate category, or by concentrating misfortunes with the less fortunate (ghetto-ization). At the "state-level of analysis" this distinguishes peace from war (and "not-war"), which is a conditional event, and security and insecurity, which are relative terms. At the more general "individual-level of analysis" the quality of peace contrasts directly with the total incidence of violence in the global system, that is, a "human security" perspective. There are many dimensions to violence but only a few are currently measureable at the holistic, global level. The most prominent dimension of violence is lethal violence, and the most dramatic form of lethal violence is organized, military action, or war. Much of what we know about the systemic qualities of peace derives originally from the classic study of inter-state war. More recently, systematic research in organized violence has expanded to cover internal uses of organized violence, that is, situations where organized violence takes place within the sovereign boundaries of a "state." However, it has only been with the advent of the 20th century's "world wars" that the problem of organized violence has been extended beyond the immediate, dyadic focus of research to the regional and global foci. Globalization is not simply an economic process but, rather, the term for the technological movement away from the dyadic analysis of "independent events" toward complex, inter-dependent, "systems analysis." The most fundamental questions for peace researchers at the present time include: "What is the general quality of peace and is it improving, stagnating, or deteriorating?" Where, and under what conditions, is organized violence most likely to occur?" "How do we understand the quality of peace in its many systemic variations, both successes and failures?"
Complex, societal systems defy comprehension but they are not immeasureable. Information and communication resources and technologies continue to improve and, as a result, there are some very general observations concerning the quality of the peace that can be made with reasonable confidence. The ending of the Second World War in 1945 provides a good beginning point for measuring the general quality of the peace. It also marks a turning point in the ways that information is generated, collected, and distributed. The rise of the independent media has been crucial in establishing a more objective perspective on the human condition and it is probably no accident that the rise of the independent media has paralleled a global trend toward greater democracy, the so-called "third wave of democratization."
The following charts provide both contextual and dynamic bases for evaluating the quality of peace. They are constructed from information covering all countries in the world with populations greater than 500,000 persons in 2008 (163 countries in 2009). Much of the data used in the following analyses is now available on the CSP INSCR Data Page. The theoretical foundations for the systemic peace perspective are explained in Monty G. Marshall, Third World War: System, Process, and Conflict Dynamics (Lanham, MD: Rowman & Littlefield, 1999). The methodology for measuring armed conflicts is explained in greater detail in Monty G. Marshall, "Measuring the Societal Impact of War," in Fen Osler Hampson and David M. Malone, eds., From Reaction to Conflict Prevention: Opportunities for the UN System (Boulder, CO: Lynne Rienner, 2002). Further analyses of conflict trends are published in Monty G. Marshall and Benjamin R. Cole, "Global Report on Conflict, Governance, and State Fragility 2008," Foreign Policy Bulletin 18.1 (Winter 2008): 3-21. Earlier societal-systems analyses are published in the Global Report (2007) and Peace and Conflict series (2001, 2003, 2005). Click on the Figures to view them in a larger size.
Figure 1
Prospects for Systemic Peace
Global System - Income Distribution, 1992 and 2005
Researchers at the Center for Systemic Peace have been monitoring general, global system performance since the Center was established in 1997. Of course, the global system itself is unique. However, our extensive systems analysis strongly suggests that societal-systems at all levels of organization share fundamental systemic attributes, involving both structure and agency. Using macro-comparative methods of "cross-national" and "comparative regionalism" research, we have observed strong and consistent correlations among qualities of conflict, governance, and development in societal-systems. Well-performing societal-systems combine non-violent conflict, democratic governance, and highly productive and self-sustaining development. Poor-performing societal systems are characterized by high levels of violent conflict, weak autocratic or anocratic governance, and low productivity and income. Plotting the distribution of income among constituent units in a societal-system, using a Lorenz curve, provides a single, and in this case stark, portrayal of the prospects of the system for conflict management in the near term. The area between the "diagonal of equality" and the "curve of inequality" measures the extent of the unequal distribution of income. The curve in Figure 1 reveals that the top 20% of the world's population receives over 80% of the income, an almost perfect inequality of income distribution and an enormous challenge for global governance, conflict management, and globalization (such highly unequal systems tend toward autocratic forms of conflict management). Slight improvement in 2005 income distribution over 1992 is accounted largely by the emergence of China in the global market. To view a more detailed analysis of the "Global System and Comparative Regionalism," including regional income distribution profiles, click here. See also, chapter six in Third World War.
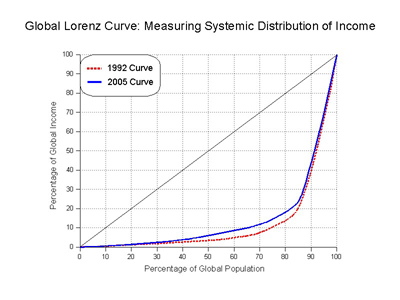
Figure 2
Global Trends in Armed Conflict, 1946-1991
The red-line charts the trend in general level of interstate war in the global system; that measure includes all wars of independence from the Colonial System and has remained fairly constant at a low level through the Cold War period. We can see from the graph that the UN System, that was designed to regulate inter-state war, has been reasonably effective in providing inter-state security. However, the UN System has not been effective in regulating societal (or civil) warfare. The level of societal warfare increased dramatically and continuously through the Cold War period. Separate research indicates that the increasing level of societal war results from the protractedness of societal wars during this period and not from a substantial increase in the numbers of new wars.Click here for a brief description of the methodology used to create the trend graph.
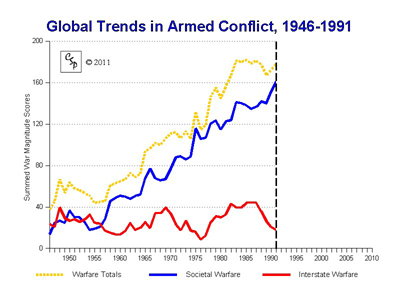
Figure 3
Global Trends in Armed Conflict, 1946-2017
The end of the Cold War, marked by the collapse of the Soviet Union in 1991, had an equally dramatic effect on the general level of armed conflict in the global system. The levels of both interstate and societal warfare declined dramatically through the 1990s and this trend continues in the early 2000s, falling over 60% from their peak levels. To review the complete listing, "Major Episodes of Political Violence, 1946-2009," used to construct the warfare trends, click here. You may also view regional trends graphs by clicking here.
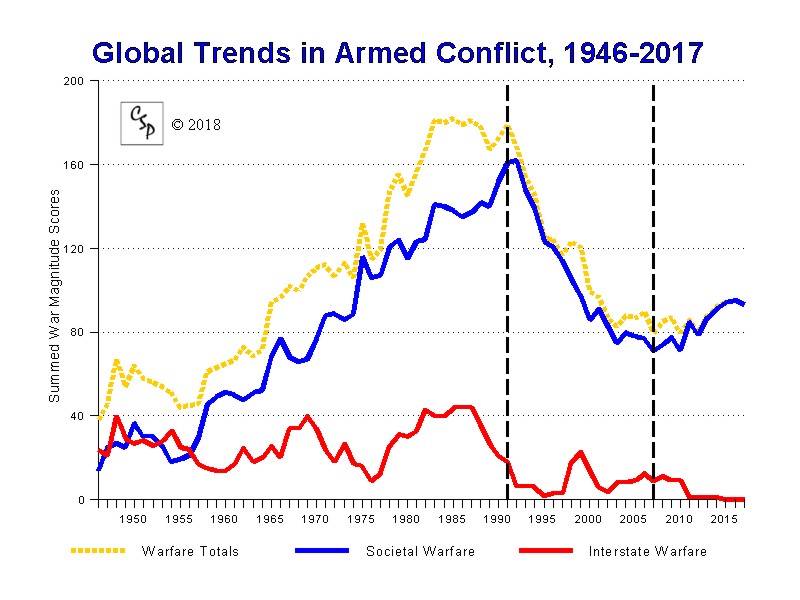
Figure 4
States Experiencing Warfare, 1946-2009
A second look at the global trend in armed conflict comes from charting the number of states experiencing any form of warfare in each year. Figure 4 charts three different metrics but the trends that emerge remain consistent with those charted in Figure 3. At the peak in 1992, nearly thirty percent of the countries in the world were experiencing some form of major political violence. This percentage of the world's independent states (with total population greater than 500,000 in 2009) has dropped by nearly one-half since the peak, registering at slightly more than 15% with major episodes of political violence in 2009.
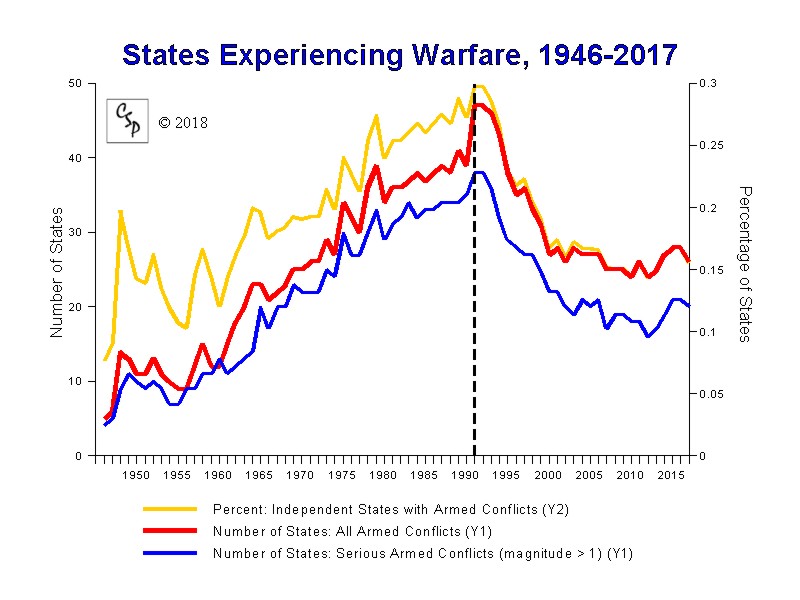
Figure 5
Global Trends in Armed Conflict Onsets, 1946-2009
A third perspective on the global trend in armed conflict focuses on the annual numbers of onsets of new wars in the global system to examine their frequency and regularity and whether there have been marked changes in those factors over time. Figure 5 charts three additional metrics:
1) number of interstate war onsets (red bars), 2) number of societal war onsets (blue bars), and 3) total onsets (orange dashed-line). The number of new war onsets fluctuates between one and thirteen per year and the number of new societal wars is generally higher than new interstate wars. There is a peak in new societal war onsets that coincides with the end of the Cold War (1990 and 1991), however, the average frequency of societal war onsets does not appear to have changed across the shift from Cold War to post-Cold War periods. The average rate of onset for societal wars changes little: from 3.7 to 3.8 per year. On the other hand, the average rate of onset for interstate wars seems to have fallen by more than half (from 1.6 to 0.7 per year); this brings down the average number of (total) war onsets from 5.3 per year during the Cold War to 4.5 per year in the post-Cold War period.
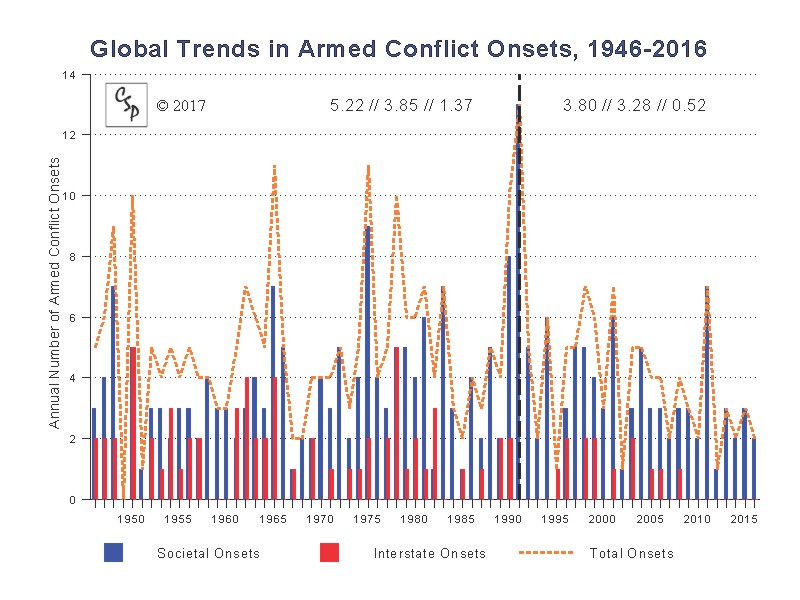
Figure 6
Global Trends in Armed Conflict Events, 1946-2009
Whereas Figure 4 looks at the annual number of states directly affected by (any number of) armed conflicts, Figure 6 charts the annual number of ongoing armed conflicts in the global system (overlaid on the onset trend data from Figure 5). This perspective on global trends in armed conflict largely parallels the charted trends in war magnitude and number of states affected, however, this measure shows some evidence that the downward global trend in armed conflicts may be leveling off in the early years of the 21st Century. In late 2009, there are 24 states directly affected by ongoing wars (27 wars total, down from 30 at the end of 2006). Of these 24 states, nearly half (11) are affected by protracted wars, that is, armed conflicts persisting for more than ten years. These protracted societal conflicts include Afghanistan (30 years), Colombia (33), D.R.Congo (16), India (56), Iraq (28), Israel (43), Myanmar (60), Nigeria (11), Philippines (36), Somalia (20), Sudan (25), Turkey (24), and Uganda (37); Sri Lanka ended its protracted war with ethnic-Tamil separatists in 2009. The remaining protracted wars continue to defy concerted efforts to gain settlement or resolution. On average, during the contemporary period, interstate wars lasted about 3 years; civil wars lasted just over 5 years; and ethnic wars lasted nearly 10 years.
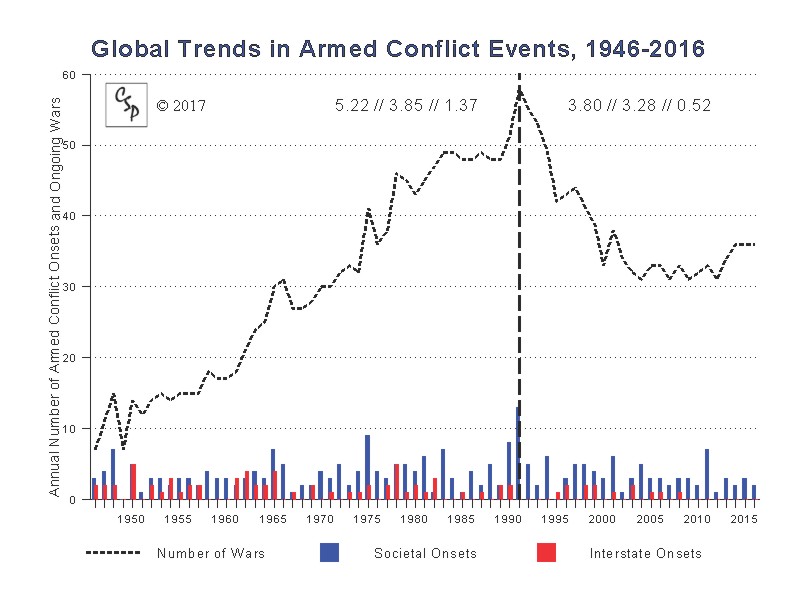
Figure 7
Refugees and Displaced Populations, 1964-2008
Figure 7 graphs the annual numbers of transnational refugees (including asylum seekers) and internally displaced civilians for all countries, as reported in the United States Committee for Refugees and Immigrants (USCRI) annual series World Refugee Survey (the most recent edition, 2009, counts displaced populations as of December 31, 2008). Beginning with the 2007 edition, the USCRI no longer reports figures for "internally displaced populations" (IDPs); estimates of IDPs are now reported annually by The Internal Displacement Monitoring Centre. The enormous increase in the global population of forcibly displaced persons beginning in the mid-1980s is difficult to ascertain. There are surely some reporting issues involved but it appears that the magnitude of the increase may be best explained by a confluence of at least four factors: 1) armed conflicts are more likely to be located in poorer countries; 2) the protractedness of societal conflicts progressively challenges the ability of societies to meet and maintain basic needs production; 3) there is a breakdown in distinctions between combatants and non-combatant populations; and 4) there is a tremendous expansion in the numbers and capacities of non-governmental organizations willing to provide humanitarian assistance to war-torn societies.
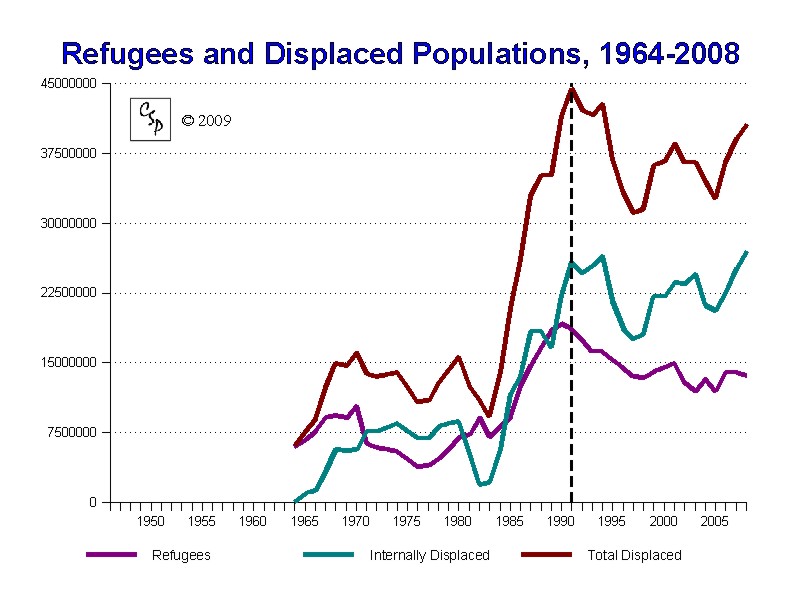
Figure 8
Societal Capacity and Warfare, 1946-2007
The Poorer Countries
Figure 8 presents a comparision of warfare trends in the bottom three quintiles countries, based on state economic capacity (GDP/capita) across the study period. Wheras the "long peace" enjoyed by the world's more affluent states is strikingly evident in Figure 9, below, this figure shows that war became concentrated in the bottom two quintiles of states (i.e., the weakest 40 percent). The poorer countries account for a disproportionate share of the global warfare totals across the period. Warfare totals for the bottom three quintiles of states increase steadily through the contemporary period, reaching their peaks in the 1980s and early 1990s. The poorest quintiles each show distinctive profiles and high levels of armed conflict that increase during the Cold War period and drop sharply around the end of the Cold War (marked by the vertical line). At the peak, over half of the poorer countries are consumed by societal warfare. What distinguishes the lowest quintile is the persistence of high levels of warfare through the 1960s, 1970s, 1980s and 1990s. This may be explained simply by pointing out that they have more fragile societal systems, more vulnerable populations, and lower capacities for properly managing conflicts than countries in the higher quintiles. This helps to explain the perceived dramatic increase in serious humanitarian crises in the 1990s. Pervasive violence and societal system breakdowns in poorly developed countries inevitably lead to humanitarian crises and disasters without substantial, constructive assistance from external sources and poor countries have trouble attracting such assistance. Comparing these trends with similar plots based on state economic capacity in the early years of the study period (our prior method) shows evidence of the degrading effects of pervasive warfare on economic capacity: armed conflict tends to occur in poorer countries and tends to keep them poor and make them poorer over time.
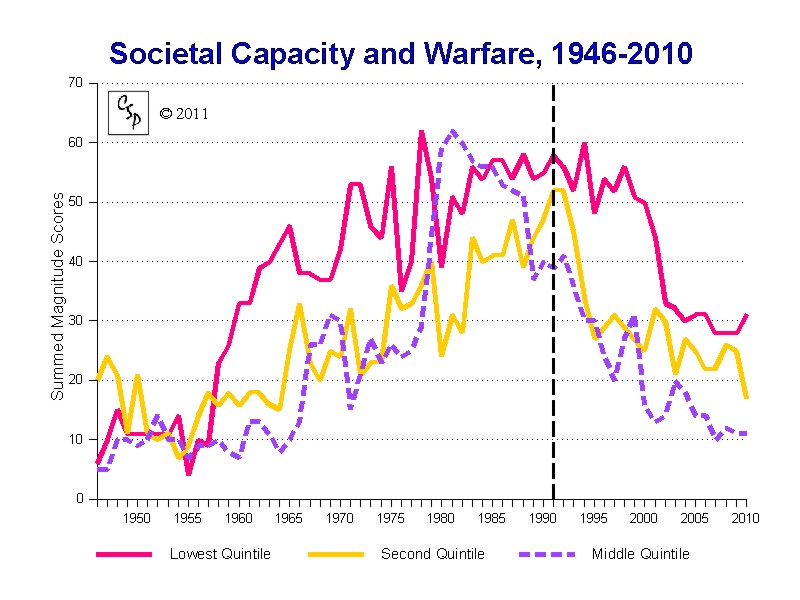
Figure 9
Societal Capacity and Warfare, 1946-2007
The Richer Countries
Figure 9 displays the warfare totals for the top three quintiles of state capacity (the third quintile is included to facilitate comparison with the bottom quintiles presented in Figure 8). Readily apparent are the much lower levels of warfare in the upper quintiles. Especially fortunate are the states in the upper quintile where little or no serious political violence takes place for the entire time span; their involvement in armed conflicts are mainly in the role of "police action" in foreign wars, particularly in "internationalized civil wars." Of course, this good fortune at home, coupled with the complexities of foreign interventions, go a long way to explaining the difficulty of mobilizing "political will" in the richer countries to recognize, let alone meaningfully address, the complex problems associated with armed conflicts in the poorer countries.
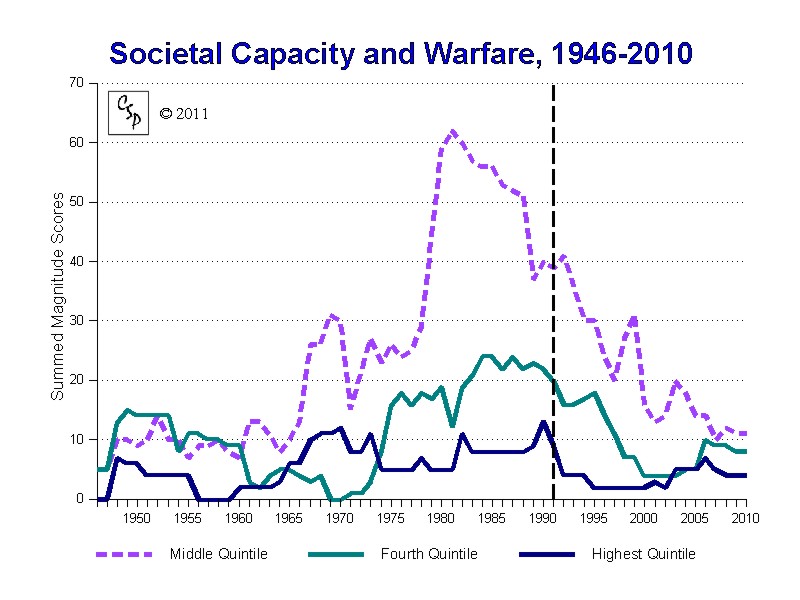
Figure 10
Trends by Armed Conflict Type, 1946-2007
Ethnic warfare became the hot topic in the years immediately following the end of the Cold War as a virtual cornucopia of these seemingly intractable (and previously "invisible") social identity conflicts exploded onto the world scene and captured the public and policy eyes. In order to more fully assess the impact and importance of ethnic conflict in the post-Cold War period it will be helpful to place that particular type of societal conflict into the larger context. Figure 10 compares trends for three distinct types of warfare, ethnic, revolutionary, and interstate. The perceived "sudden rise" in ethnic wars in the 1990s appears to be a curious outcropping of the more general, systemic changes. As the Cold War ideologies wax and wane in the late 1980s, the support they lend to both interstate and revolutionary intrastate wars is eroded and those types of warfare greatly diminish. Ethnic wars, which had previously paralleled the trend of revolutionary war, continue to rise through the late 1980s and early 1990s as separatists and other political entrepreneurs attempt to take advantage of the vast changes in political arrangements that accompanied the transformation of the post-Cold War world system. Ethnic wars stand out like a "sore thumb" in the 1990s' security environment. Also, notice that the long-term trend in ethnic warfare increases relatively smoothly as compared to the other warfare trends. As the goals of social identity conflicts are suffused with non-negotiable identity issues, these conflicts tend to persist and, so, are less susceptible to settlement or resolution by warfare. Thus, ethnic warfare trends are less ammenable to periodic fluctuation.
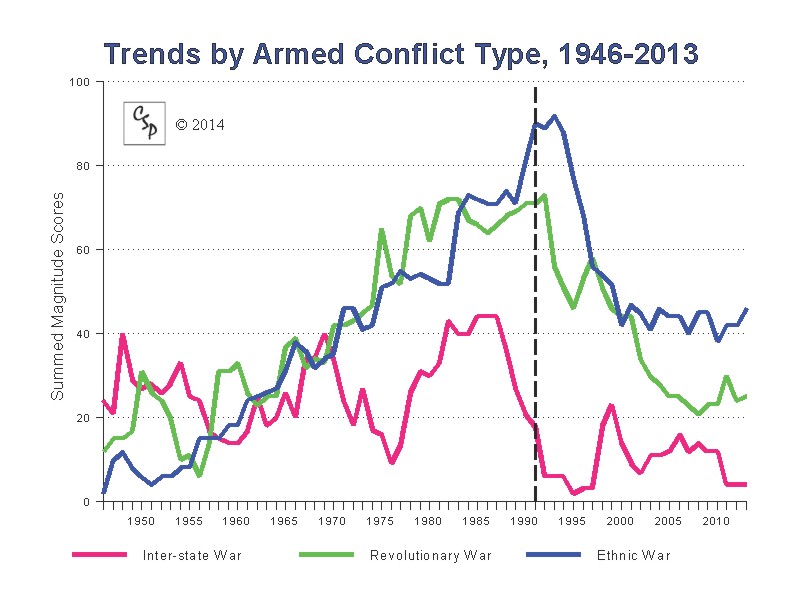
Figure 11
Global Democracy and Autocracy, 1946-2012
Figure 11 simply sums Polity IV scores of institutional authority for democracy and autocracy for each independent state for each year; Polity IV special codes (-66, -77, -88) are treated as missing data here. In the Polity IV data each country is given annual scores (10-point scales) on each of two basic types of regime authority. Although the two types of authority are opposing, many countries exhibit mixed authority traits (i.e., they have middling values on each scale). The graph in Figure 11 shows global changes in total "units of democracy" in contrast to total "units of autocracy" in the global system.
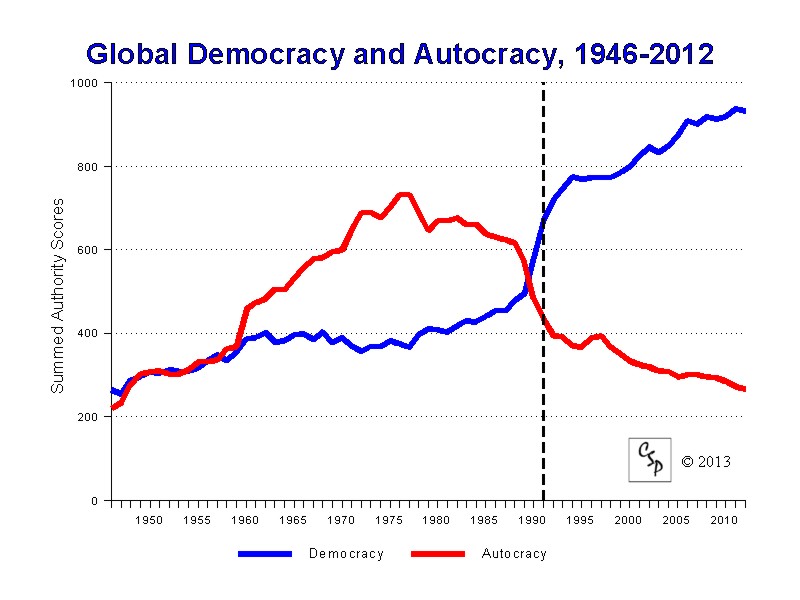
Figure 12
Global Trends in Governance, 1946-2012
Figure 12 provides a second perspective on the global trend in governance. This graph was originally designed for inclusion in the UN Secretary General's Millennium Report. It uses Polity IV data on institutional authority for all independent states in the world from 1946-2009. The trend lines denote the annual number of states with each of three general authority patterns: democracy, autocracy, and anocracy. The Polity score combines the separate Autocracy and Democracy scores mentioned above into a single indicator of governance, ranging from -10 (fully institutionalized autocracy) to +10 (fully institutionalized democracy). In this rendition, Democracies are designated by having a Polity score of +6 or greater; Autocratic states have a combined score of -6 or less. Anocracies are a middling category of states with incoherent or inconsistent authority patterns: partly liberal, partly authoritarian (i.e., -5 to +5 on the Polity scale). The Anocracy category also includes countries with any of the three special Polity codes: -66 (interruption), -77 (interregnum), and -88 (transition). Anocracies are relatively vulnerable and volatile states that often lack effective institutions and/or the capacities to establish and maintain social order.
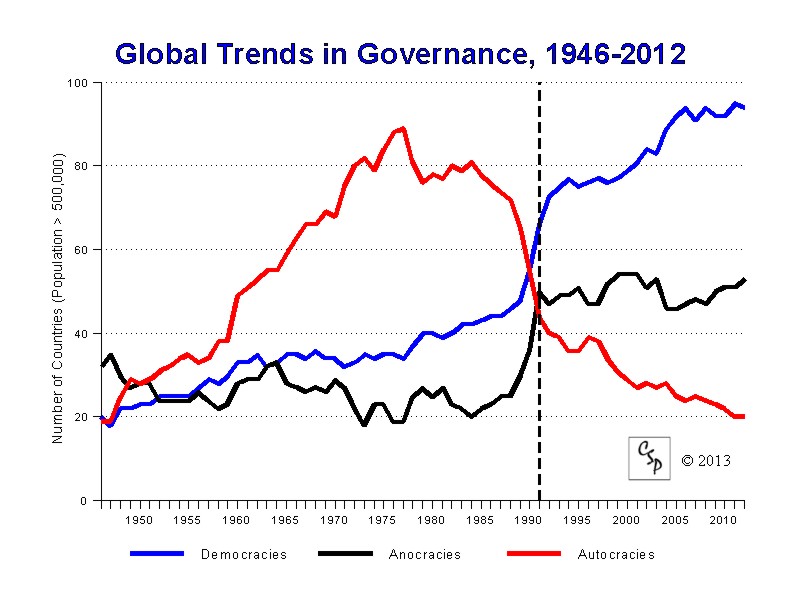
Figure 13
Annual Likelihood of Political Instability by Polity Score, 1955-2006
Figure 13 charts the relationship between a regime's Polity score and the likelihood of onset of a political instability event. The Political Instability Task Force (PITF) identifies four categories of instability events: 1) an "adverse regime change" (defined by a sudden five-point or more drop in a state's Polity score or a collapse of central authority); 2) a "revolutionary war" pitting a non-state challenger against state forces and resulting in 1000 or more "battle-related deaths"; 3) an "ethnic war" pitting a distinct ethnic group against the state, also, resulting in 1000 deaths of more; and 4) a genocide or politicide defined as the deliberate use of lethal violence by state agents against members of a distinct social or political group by state. CSP includes a fifth category of instability event, a "major democratic transition," identified by the weakening or reform of autocratic authority and defined by a sudden five-point or more drop in a state's (Polity) Autocracy score. Figure 13, then, plots the likelihood of the onset of an instability event for each value along the 21-point Polity scale; it further demarcates the three categories of regime type on the scale. The magenta line plots the annual likelihood for an onset from any of the full, five categories described above (including democratic transitions); the dark blue line plots the annual likelihood of onset for any of the four PITF categories. The teal line plots the annual likelihood of the onset of a period of political instability (i.e., a "consolidated case" within which there may be one or more instability events covering a continuous period of time during which there is never more than a five-year span of political stability); onsets for this set of cases can only occur in a year of political stability, so, the likelihood for this set is determined by a reduced set of "stability years." Regardless of the definition of "instability," Anocracies (-5 to +5 on the Polity score) clearly have the greatest risk of instability, while autocracies and unconsolidated democracies have a lesser, yet still substantial, risk. Fully institutionized democracies (+10 on the Polity scale) are associated with the lowest risk of onset of a political instability event, by far. By discounting instability "caused" by democratic transitions in autocracies, an impression that autocracies are similarly, or even more, stable as compared with democracies. Autocracies are seven to ten times more likely to experience an onset of instability compared with "fully institutionalized democracies" (+10 on the Polity scale). Note that these plots are smoothed by using three-category averages; this reflects the estimated error in the Polity measure (+/-1 point); dashed lines plot onsets using the POLITY2 score which assigns standard scores to -88 and -77 cases.
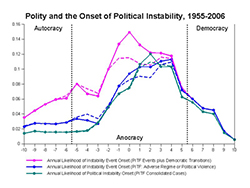
Figure 14
Regime Type by Income (Quartiles), 1980s and 1990s
Whereas Figures 11 and 12, above, clearly show the evidence of a "third wave" of democratization that coincides with the end of the Cold War and the general decline in global armed conflict (Figure 3), Figure 12 also shows a nearly three-fold increase in the numbers of "anocratic" (hybrid) authority regimes. Our research and, particularly, the PITF research have shown that anocratic regimes have the highest risk of political instability (Figure 13). The simultaneous and dramatic increase in anocratic regimes in the global system and decrease in global armed conflict, especially in light of the unchanged rate of onset for armed conflict events, appears to present a paradox, or at least a conundrum. Anocracies seem to have a lower, or slower, risk of instability in the post-Cold War world. Figure 14 reveals another piece in the puzzle by comparing the general relationship between per capita income and regime type for the two decades just prior to and after the end of the Cold War (i.e., the 1980s, left side, and 1990s, right side). The linear relationship between societal-system development (measured by GDP/capita) and mode of governance has broken down in the later period and countries in the lower three quartiles of income appear to be having trouble establishing and consolidating democratic authority. Premature democratization in poorer countries poses unique challenges for the global system.
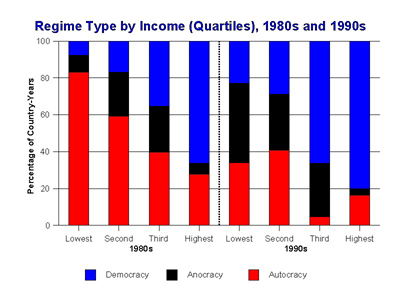
Figure 15
Armed Conflict in Muslim Countries, 1946-2013
With the global "War on Terrorism" holding our attention since the infamous 9/11 al Qaeda attacks on the territorial isolation and icons of US global power, interest has often focused on discontent, hosility, and militancy in the "Muslim World." The question arises whether the general trend in armed conflict in the "Muslim World" differs from the trend in the "non-Muslim world." Figure 15 presents a graphic comparison of armed conflict trends in three subsets of the world's countries: 1) countries with Muslim majorities (red line); 2) countries with substantial Muslim minorities (greater than 5% of the population; green line); and 3) non-Muslim countries (purple dotted line). The Muslim majority countries account for about one-sixth the world's population. The Western democracies of Europe and North America have experienced very little armed conflict, on their territory, during the contemporary period and, so, this subset of countries and global population (about one-sixth) can be discounted from the trends graphs. The other two subsets represented in the graph account for roughly equal portions of the global population (about two-sixths each). With this in mind, we can see from the graphs that the armed conflict trend for Muslim majority countries (about one-half the population of non-Muslim/non-Western countries) runs at about one-half the magnitude for the non-Muslim countries until the late 1970s, making the two subsets roughly equal in levels of armed conflict during this period. However, the trend in Muslim majority countries increases very sharply in the late 1970s and early 1980s and very quickly surpasses the level for non-Muslim countries. On the other hand, armed conflict in the Muslim minority countries is substantially lower than that in the non-Muslim countries until the late 1980s, even though they are roughly comparable in population. All three trends have diminished in recent years and are now, in 2007, at roughly the same level (however, this means that the general level of warfare in Muslim majority countries is about double the level in the non-Muslim and Muslim minority countries when considered on a "per capita" basis).
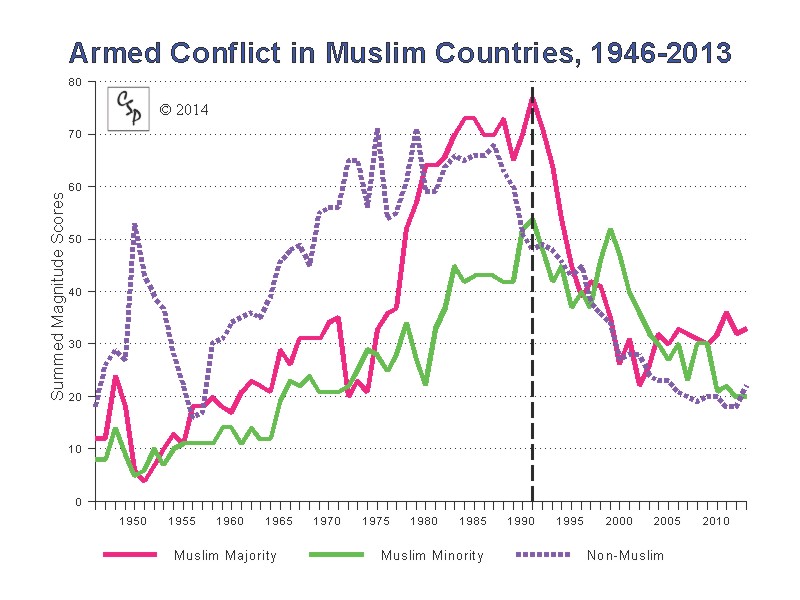
Figure 16
Annual Numbers of International Terrorism Attacks, 1990-2008
Figures 16 and 17 draw upon data provided by the RAND-MIPT Terrorism Knowledge Base (www.tkb.org) in order to chart recent trends in international terrorism. The RAND-MIPT database is one of two comprehensive compilations of international terrorism events; the other being the ITERATE database. Figure 16 shows a general decrease in the numbers of attacks during the decade following the end of the Cold War; this trend is corroborated by similar analyses of the ITERATE data. The incidence of attacks increases substantially in the post-9/11 period. RAND-MIPT provides the following definitions of these events:
Terrorism: "For the purposes of [the Terrorism Knowledge Base (TKB)] data, terrorism is defined by the nature of the act, not by the identity of the perpetrators or the nature of the cause. Terrorism is violence, or the threat of violence, calculated to create an atmosphere of fear and alarm. These acts are designed to coerce others into actions they would not otherwise undertake, or refrain from actions they desired to take. All terrorist acts are crimes. Many would also be violation of the rules of war if a state of war existed. This violence or threat of violence is generally directed against civilian targets. The motives of all terrorists are political, and terrorist actions are generally carried out in a way that will achieve maximum publicity. Unlike other criminal acts, terrorists often claim credit for their acts. Finally, terrorist acts are intended to produce effects beyond the immediate physical damage of the cause, having long-term psychological repercussions on a particular target audience. The fear created by terrorists may be intended to cause people to exaggerate the strengths of the terrorist and the importance of the cause, to provoke a governmental overreaction, to discourage dissent, or simply to intimidate and thereby enforce compliance with their demands."
International Terrorism: "Incidents in which terrorists go abroad to strike their targets, select domestic targets associated with a foreign state, or create an international incident by attacking airline passengers, personnel or equipment."
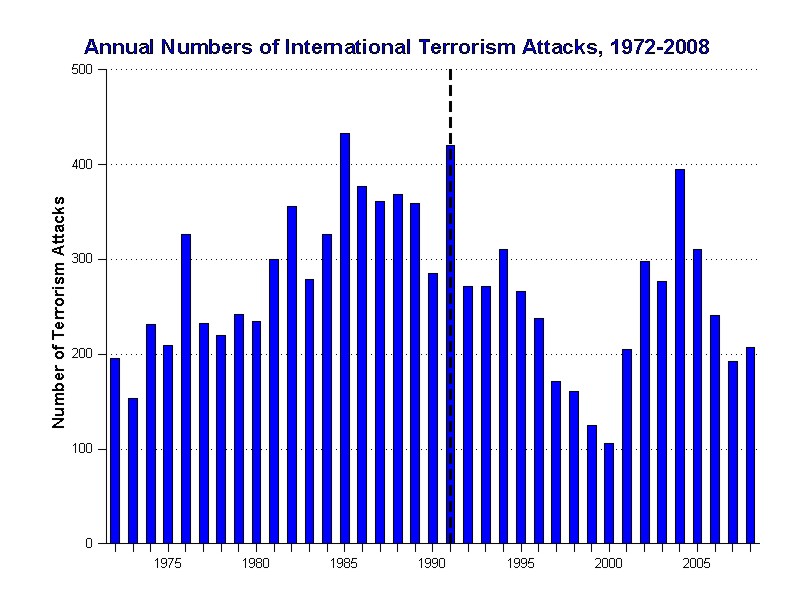
Figure 17
Annual Numbers of Deaths from International Terrorism, 1990-2008
Figure 17, then, uses the RAND-MIPT Terrorism Knowledge Base to chart the annual numbers of deaths that resulted from the attacks charted in Figure 15 above. One can immediately see the extraordinary impact of the 9/11 attacks on the USA; these four attacks in New York City, Washington DC, and Somerset County PA account for 2,982 deaths (all but 200 of the death total in 2001). The average number of deaths in the eleven years preceding 2001 is 276; the average for the four years following 2001 is 665, more than double the average for the earlier period. Still, these annual totals are extremely low when compared to other forms of political or criminal violence. The CSP study on "Global Terrorism: An Overview and Analysis" proposes that "international terrorism" accounts for less than ten percent of global terrorism since 1990; the vast majority of global terrorism is local, or national, terrorism. The rates for international terrorism are further qualified by the tremendous increases in international activity that has accompanied "globalization" and the post-Cold War expansion of the free market system.
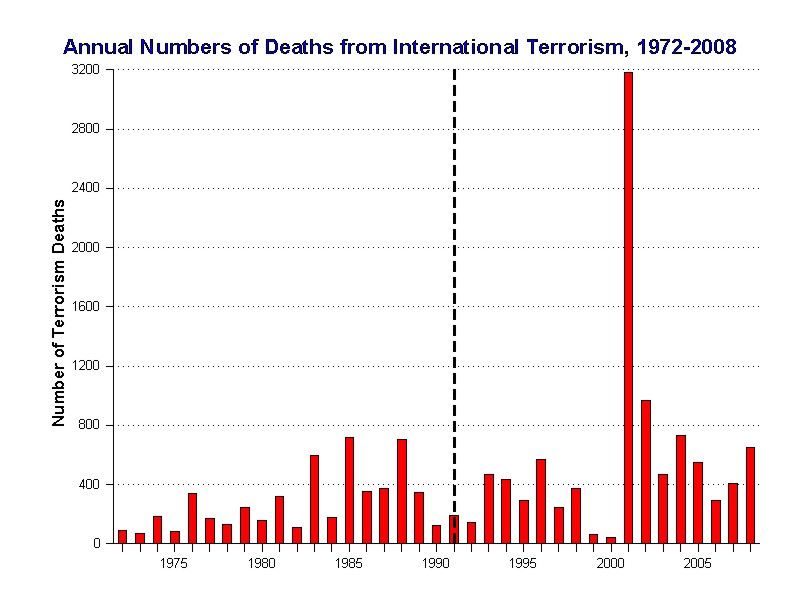
Figure 18
High Casualty Terrorist Bombings, 9/11/1989 - 9/10/2018
Figure 18 provides a unique examination of recent, global trends in "high casualty terrorist bombings" (HCTB; that is, bombings that result in 15 or more deaths); each bar charts the total number of HCTB deaths in successive six-month periods pre- and post-9/11/2001. While the frequency and lethality of "international terrorism" does not appear to have increased much in recent years and, in any case, remains at extremely low levels when compared with any other form of political or criminal violence, the tactical use of "low-tech, smart bombs" (mainly car bombs and suicide bombers) against "soft targets" (mainly political and civilian targets) has increased dramatically since the 9/11 attacks (in which 2,982 people were killed). However, most of the increase is these "high profile" terrorist attacks have been confined to a handful of localities: Russia, Afghanistan, India, Pakistan, Sri Lanka, and, especially, Iraq. While the rise of the "super-empowered terrorist" as an innovation in tactical or criminal violence is certainly a disturbing trend, the evidence shows that it remains an extreme and relatively rare event. HCTB attacks have killed more than 23,875 people since 9/11, with nearly sixty percent of the killings having taken place in Iraq (13,862). While HCTB attacks in Iraq have decreased dramatically beginning in September 2007, they remain at high levels (684 deaths in the most recent period). HCTB attacks in Pakistan have increased substantially since 2007 and the number of HCTB deaths in Pakistan surpassed those in Iraq in the period ending March 10, 2010 (816), falling just below the level in Iraq during the most period (633). HCTB deaths have been increasing steadily since reaching a low point in the period spanning from September 11, 2008, to March 10, 2009. Note: Armed assaults on civilian targets that rely mainly on firearms or other hand-held weapons (such as the November 2008 assault on Mumbai, India, that resulted in 173 deaths) are not included in this compilation. The numbers of deaths attributed to "death squad" activities often far surpasses the death totals of the HCTB events recorded here.
To view a PDF copy of the HCTB events list, click here.
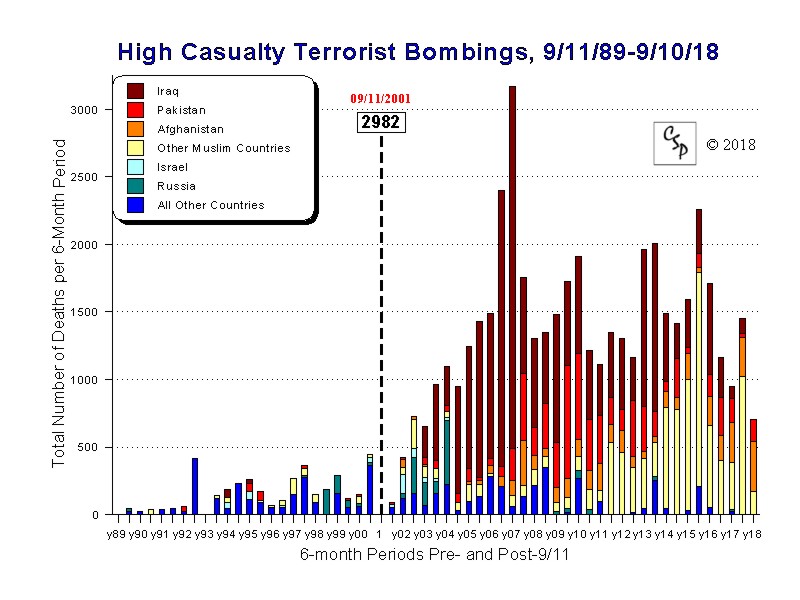
Figure 19
State Fragility Index 2017
Effective conflict management and, therefore, systemic peace result from a fundamental congruence between societal-system resilience and the systemic risk factors that would otherwise "trigger" contention and "fuel" the escalation to violence. Global Report 2009 includes a detailed assessment of "state fragility" for each of the world's 162 major countries (with populations greater than 500,000) that comprises a 2x4 matrix of indicators (effectiveness and legitimacy indicators for security, governance, economic, and social dimensions of state performance) rated on a scale of 0 (no fragility) to 3 (high fragility). The economic effectiveness indicator includes an extra "extreme" value (4) identifying countries locked in extreme poverty, defined as GDP/capita less than $400. These eight indicators are, then, summed to form composite indices of (il)legitimacy and (in)effectiveness; the comprehensive "state fragility index" combines these two key indices. Figure 18 shows a concentration of extremely, highly, and seriously fragile states in Africa and across southern Asia. Fragility in the Western Hemisphere is less severe and concentrated in Central and in north and central South America. We find that there has been a steady improvement in general resilience in the global system since 1995 with similar, absolute improvement in the five non-Western world regions; however, the "resilience gap" has been maintained in relative terms.
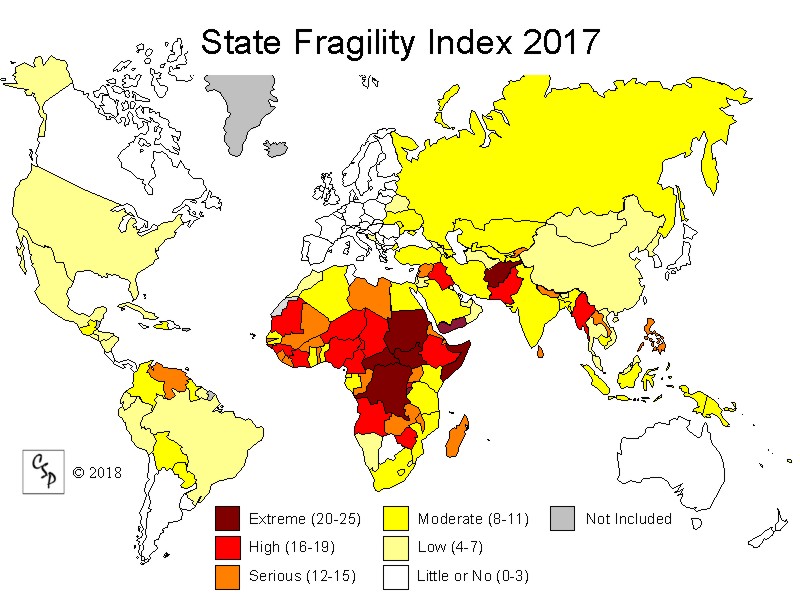
The most substantial improvements are found in the former-Socialist states of eastern Europe and in Latin America; the most limited improvements are noted in the Sub-Saharan Africa and Muslim regions. Global gains are observed for seven of the eight fragility indicators; only "economic legitimacy" shows no improvement since 1995, indicating that there has been no substantive shift away from primary commodities export toward manufactured goods in the world's more fragile states. Gains in effectiveness have outpaced gains in legitimacy. Click on the map at right to compare the 1995, 2002, and 2009 state fragility maps and view two graphs summarizing progress made in reducing state fragility since 1995. Copies of Global Reports 2007, 2008, and 2009 can be found in the CSP Virtual Library.
The State Fragility Matrix for the most current year (2017) is now available.
Click here to view the full listing of 2017 State Fragility scores for 163 countries,
accompanied by the State Fragility map and graphs detailing global progress in reducing fragility since 1995.
The full, annual State Fragility time-series data (1995-2009) is available on the INSCR Data Page.
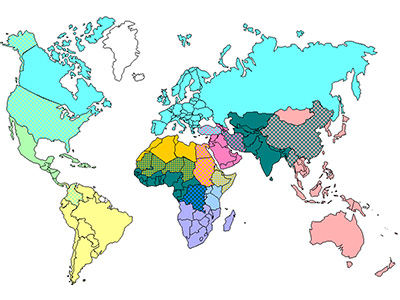
Regional Trends in Armed Conflict and Governance, 1946-2006
Regional warfare and governance trends are now updated through 2006
and are presented for ten politically-relevant "neighborhood" contexts; solid color countries are listed in only one region and
multi-colored countries are considered "straddle states" and are listed in two or more adjoining regions.
Click the relevant area of the global map, or the hyperlinks in the table below, to view the regional graphs.
The Armed Conflict and Intervention (ACI) and Polity IV projects are part of both CSP and the Center for Global Policy, George Mason University. Both the ACI and Polity IV projects are directed by Monty G. Marshall. The Polity IV project codes annual data on Political Regime Characteristics and Transitions over the period 1800-2007 for all countries in the world with populations over 500,000 in the most recent year recorded (2007). For more information, click here.
The ACI project codes levels of violence in all types of major armed conflicts in the world during the period 1946-2010. Major armed conflicts involve at least 500 fatalities and may be of any type: inter-state or intra-state; they include all episodes of international, civil, ethnic, communal, and genocidal violence and warfare. Episodes are coded on a scale of one to seven according to an assessment of the full impact of their violence on the societies that directly experience their effects; the effects of political violence and warfare include fatalities and casualties, resource depletion, destruction of infrastructure, and population dislocations, among other things such as the psychological trauma to individuals and adverse changes to the social psychology and political culture of affected social identity groups. The resulting categories represent standardized event magnitudes based on levels of societal affect (i.e., a measure of the general magnitude that a society's normal networking and functioning is affected by violent disruption); the categories are considered comparative units of measurement. Global and regional trends in warfare are visualized graphically by aggregating the coded scores for all ongoing episodes of major armed conflict in a given year in all independent states. For a more detailed explanation of the coding methodology, click here. CSP presents the global and regional warfare trends graphs with great confidence in their accuracy, reliability, and comprehensiveness and contends that the foundation for the trends (i.e., the global system) provides a constant "universe of analysis" through the contemporary period. To review the complete listing, "Major Episodes of Political Violence, 1946-2010," used to construct the warfare trends, click here. The ACI project also produces the annual lists of Internal Wars and Failures of Governance used by the US Government-sponsored State Failure Task Force (now renamed the Political Instability Task Force). For more information on the data resources and ongoing research of the Task Force, click here.
Although the general global trend in armed conflict continues to decrease in the early years of the 21st century, there are some counter-trends that should be acknowledged:
- Escalation of Long-Standing Disputes or Rivalries. Nearly all of the armed conflicts that crossed the threshold to serious warfare in the 1990s and 2000s involved an escalation in a long-standing dispute rather than an outbreak of a new conflict.
- Separatism. Many of the most serious incidents of warfare in the 1990s and 2000s involved escalations in attempts by distinct ethnic groups to gain (or maintain) separation from a central authority unwilling to accept it.
- Black Market Control. Many of the 1990s' and 2000s most serious wars involved conflicts over the control of black market commodities and assets that can be easily liquidated through illicit trade, such as drugs and diamonds. Wars have become a "pay-as-you-go" proposition as the global arms trade becomes increasingly "privatized."
- Bad Neighborhood Effects. In general, new outbreaks and escalations of serious warfare in the 1990s and 2000s tended to occur in particular regions, or "systemic neighborhoods," where ongoing, serious armed conflicts were already taking place, just as they have throughout the contemporary period.
- Islamic Anti-Globalism. In response to the September 11, 2001, unconventional attacks by hijacked, private airliners on symbolic targets in New York and Washington, DC, US President Bush launched a series of "pre-emptive" engagements against agents of "global terrorism." These engagements have included the forcible ousters of the Taliban regime in Afghanistan in late 2001 and the Saddam Hussein-led Ba'athist regime in Iraq in 2003. The full course and effects of the still emerging "war on terrorism" will have on the global system are not yet fully known. Nearly two-thirds of new wars since 2001 have taken place in Muslim-majority countries or involved Muslim minority groups.
- Controlling World Oil Reserves. The US invasion of Iraq in April 2003 may mark the first major "enforcement action" to secure the world's oil reserves and ensure that they remain available to and subject of "global market forces." It is also an example of a "domesticized interstate war" as the invasion by US armed forces triggered, first, resistance by Iraqi armed forces, second, an armed resistance by indigenous and foreign militants, and, third, a communal war among Sunni, Shia, and Kurd communal groups. In the first decade of the new millennium, nearly all the world's major oil reserves, outside those located in the northern hemisphere, are secured under strictly autocratic governments, in contrast to the "third wave of democratization" sweeping the rest of the southern states. Increasing competition for oil is placing enormous pressures and strains on non-industrial, oil-producing states and a new global activism among major, oil-consuming states.
For more information please contact the Center for Systemic Peace.
Center for Systemic Peace
7939 Heather Mist Drive
Severn, MD 21144
USA
(202) 236-9298