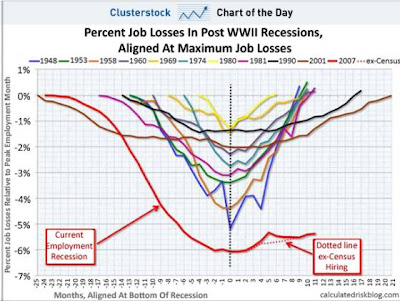
Employment rates during recessions in US
Employment rates during recessions in US
Level
Image Type
Geographic Area
 Visualizing sustainable solutions to global and local problems so society makes informed choices quicker.
Employment rates during recessions in US
spot oil prices in Texas over the past 40 years
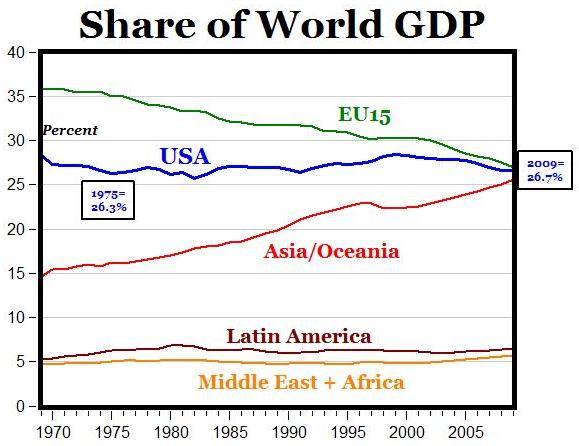
Share of World GDP
<a href="https://wrsc.org/sites/default/files/images/2011/percent_of_gdp_graph.jpeg">https://wrsc.org/sites/default/files/images/2011/percent_of_gdp_graph.j…</a>
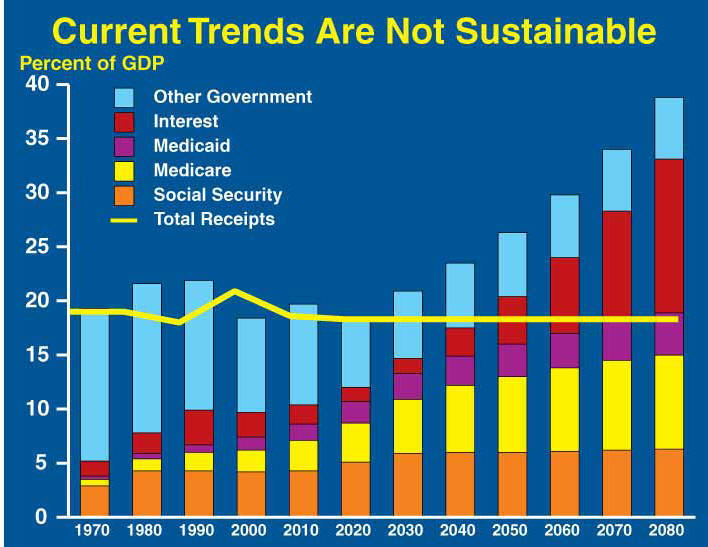
Projected spending vs.projected GDP graph
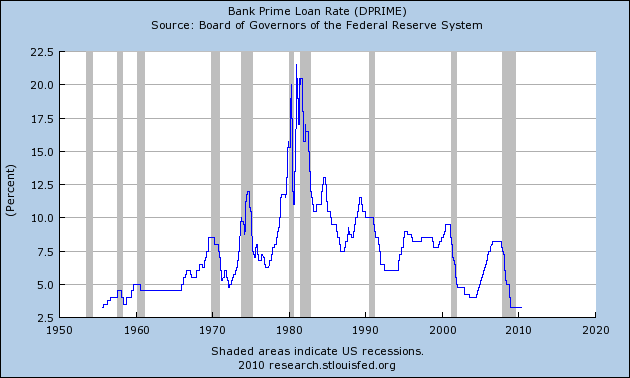
Bank prime loan rates from 1950 to 2010
Comparing job changes in different recessions in US history
Current Trends Are Not Sustainable
This graph shows Government spending, expressed as a percent of GDP, in ten-year intervals for 1970 to 2080. The chart also shows Government receipts, expressed as a percent of GDP, as a line from 1970 to 2080.
<a href="https://www.sandag.org/uploads/projectid/projectid_355_10793.pdf">https://www.sandag.org/uploads/projectid/projectid_355_10793.pdf</a>
Projected Regional Results: Population, Jobs, Housing, 1970-2050
From the San Diego 2050 Report from SANDAG.
Atmospheric Carbon Dioxide from Mauna Loa, Hawaii from IPY III (1957-58) to IPY IV (2007-2009)
Also known as the "Keeling Curve"
You might not know this (most people don’t,) but 2007-2008 is an International Polar Year (IPY). More than 60 countries, including the U.S., have developed large-scale polar research projects that rely heavily on international coordination and collaboration.
cleantehnica.com
Projected growth of Solar Installations to reach 10 GW in 2015